


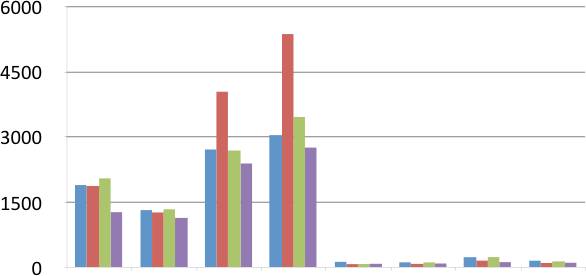
Here is a chart of the 2008 NIST testing of smoke alarms. NIST tested two dual sensor alarms, an ionization and a photoelectric.
Here is a clear visual of how the alarms performedin the individual tests. You can see in the flaming tests the alarms were within seconds of one another. The ionization actually was almost 30 seconds faster than the photoelectric. HOWEVER, you can see in the smoldering tests, that leading cause of residential fire deaths, the photoelectric was 39 minutes faster in one of the tests and was significantly faster than the ionization all the time. Interestingly in a NIST test four years earlier, the photoelectric beat the ionization by 55 minutes.
The Barre City Fire Department tests also demonstrated these same differences.
Also, in case some of you are looking at the dual sensor in this chart, notice how consistently Dual #2 beat Dual #1. This is because manufacturers can manipulate the sensitivity levels. The problem is when the ionization gets paired with the photoelectric technology you have them running off the same battery and you have to live with the 20% disabling due to nuisance alarms factor.
It appears that when manufacturers sent their alarms to NIST for testing, they increase the sensitivity levels to get them to perform better. However at this increased sensitivity level they probably would not be acceptable in a home because of increased false alarms . . .
We’ll address the false alarm issue shortly.


(c) Copyright July 09
NIST 2008 - Alarm Time in Seconds
Photo
Legend

Ion
Dual 1
Dual 2
39 minutes later than photo


Type / Stage of Fire